Paper: An advanced model to study the possible thermomechanical damage of lubricated sliding-rolling line contacts from soft particles.
Author: George K. Nikas
Published in: Transactions of the American Society of Mechanical Engineers (ASME), Journal of Tribology, 2001, 123(4), 828-841
Abstract
A model presented earlier by the author [1, 2, 3] for the study of the possible risks associated with the entrapment of debris particles in lubricated contacts has been refined to account for additional influential factors that could affect the results obtained from the initial model. The new results showed that soft contaminants could indeed be very destructive and damage a concentrated sliding contact mainly due to the thermal stresses developed from the frictional heating of the contact during the plastic compression and shearing of a particle. This model yielded flash temperatures of the order of 100 °C and up to 2000 °C (or more, until local yield occurs). It also showed that it is often the thermal stresses, which cause the problems, rather than the mechanical stresses from particles’ deformation.
Some figures from this work
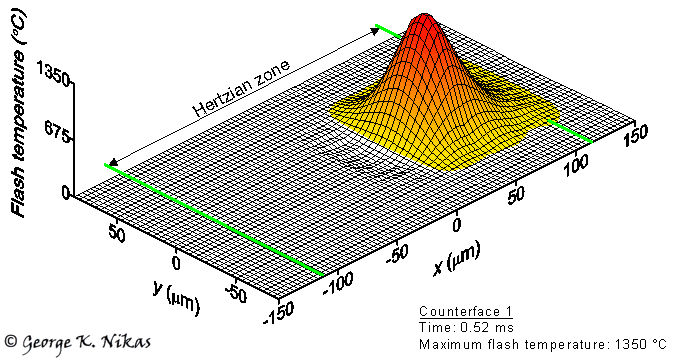
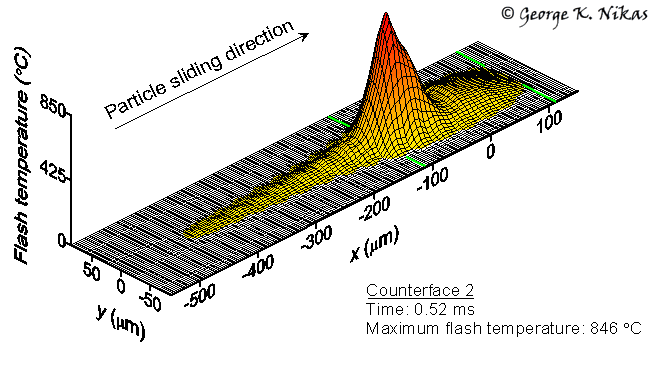
The destructive nature of soft metallic particles can be clearly seen in the following figures. Figure 1 shows the flash temperature distributions on the counterfaces of a typical elastohydrodynamic contact (central film thickness = 0.7 microns) as a solid soft spherical particle is trapped, squashed and passing through the contact. The particle sticks to counterface 1 (which has a higher friction coefficient than 2) and slides on counterface 2 until it exits the contact. The particle needs only 0.54 ms to pass through, but this "infinitesimal" time is enough for the squeezed particle to produce enough frictional heat and raise the temperature of the surfaces by 1350 °C on counterface 1 and 846 °C on counterface 2, despite the fact that the particle is 8 times softer than the counterfaces at the beginning of its compression.


Fig. 1. Flash temperature distribution on the surfaces of an EHD contact during the passage of a soft particle.
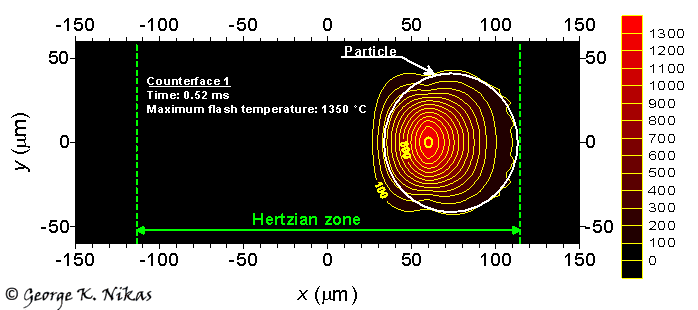
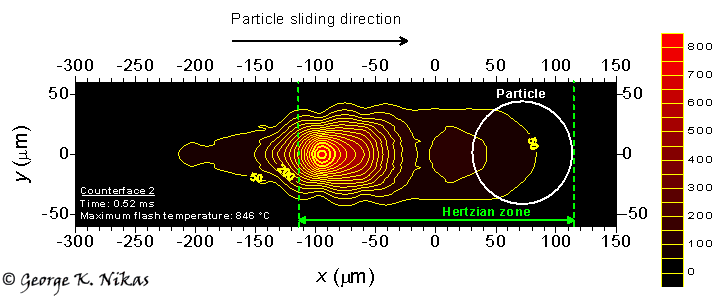
The temperature contour maps for the above figure are shown in Fig. 2 below. Notice the hot spot the particle leaves behind as it moves to the exit of the EHD contact.


Fig. 2. Flash-temperature contour maps corresponding to Fig. 1.